QUANTUM Curve maker
Quickly build pool performance curves utilizing Quantum Pool Script and our auto-scaling cloud infrastructure.
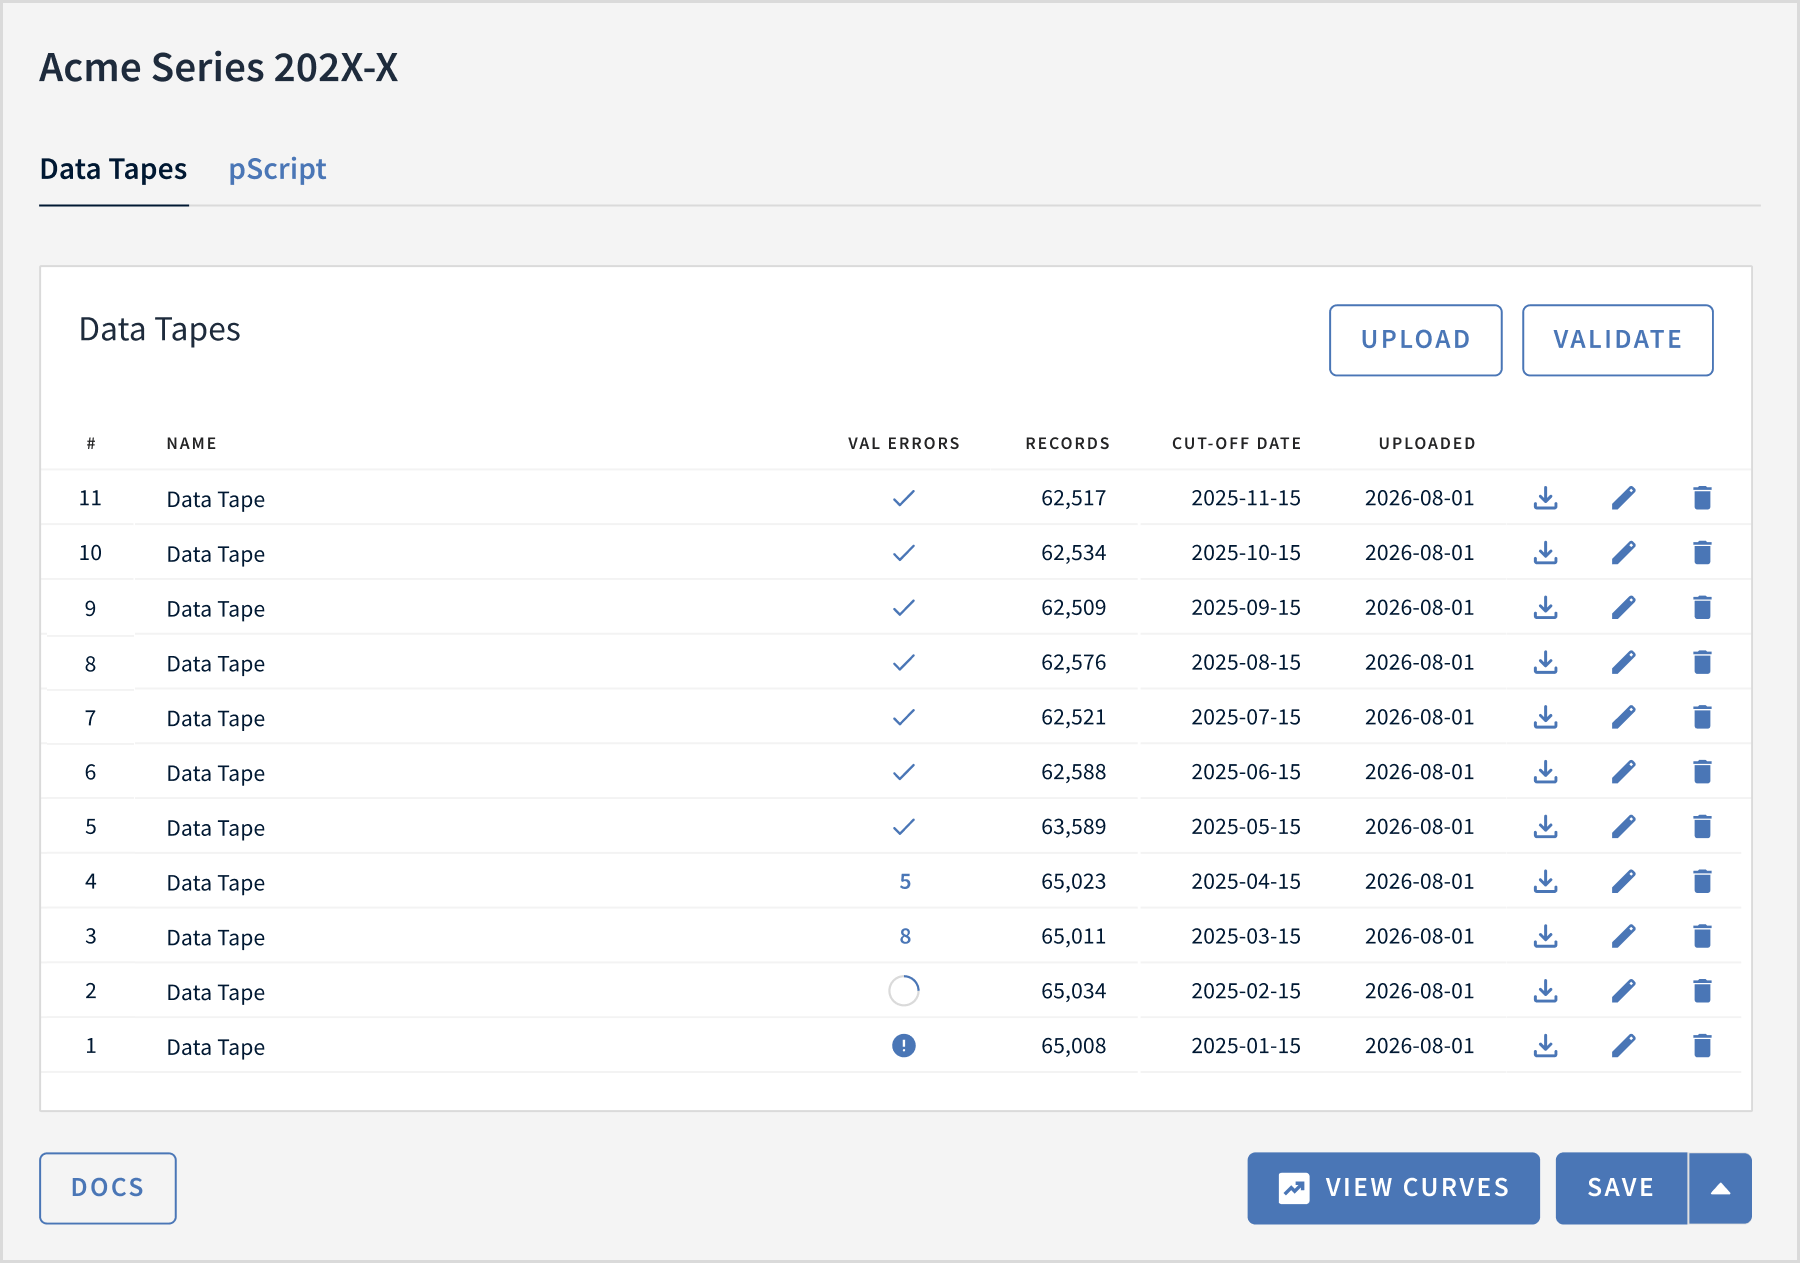
The first challenge in generating pool performance curves is processing the enormous data set. Quantum offers deal teams a fast and intuitive interface to upload and validate loan-level data, at unlimited scale.
Create collateral historical performance analysis at the corporate, project or deal-level.
Upload a single multi-period data tape, or multiple single-period data tapes.
Quantum converts the data tape(s) into binary format to unlock "big-data" scale processing.
Data tapes are then available to run validation and historical computation via Quantum pScript.

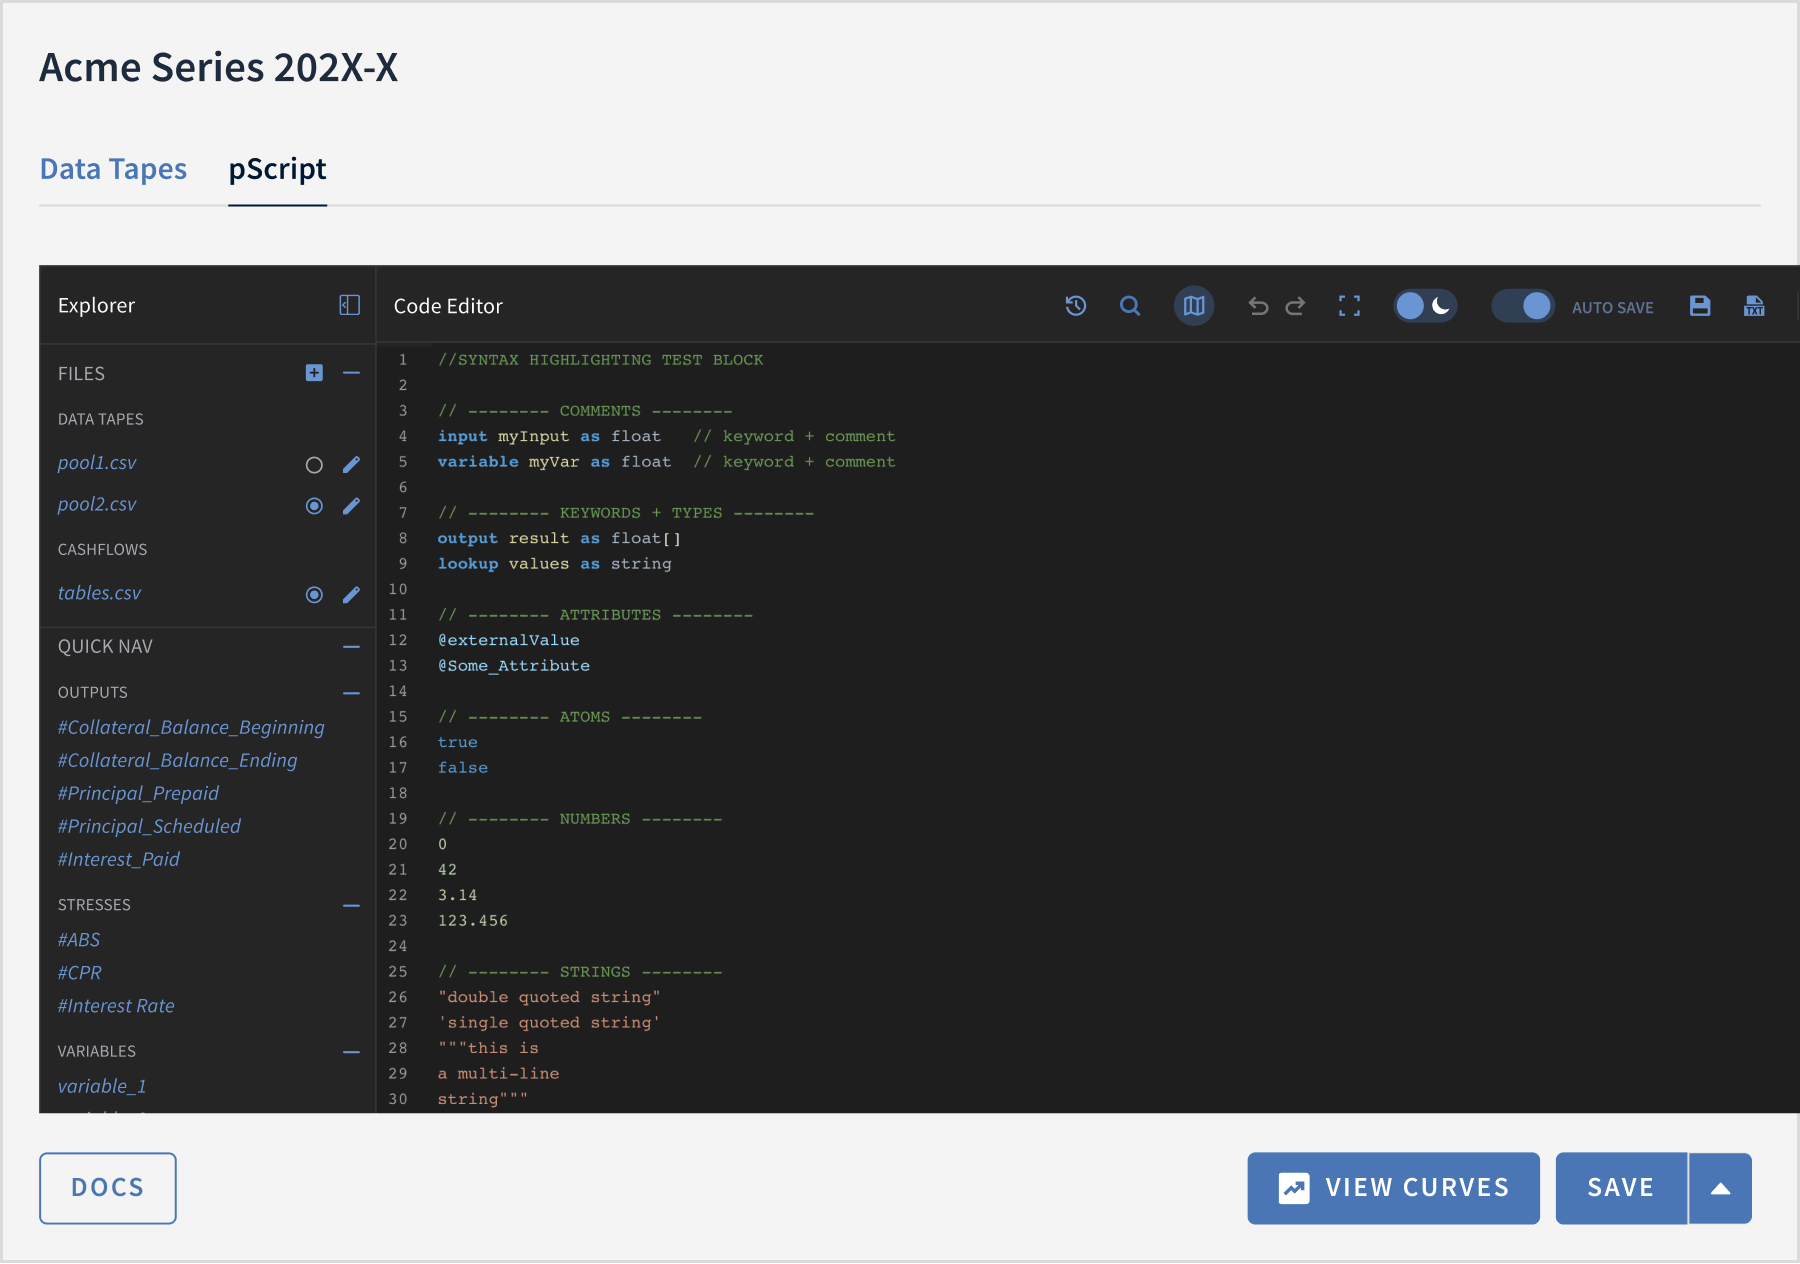
Pool Script (pScript) is a derivation of Collateral Script (cScript). Where the cScript compiler uses a single data tape to project cash flows into the future, pScript analyses historical data tapes to calculate changes over time.
pScript’s compiler automatically accesses any data tapes uploaded.
Modelers can implement validation checks to mitigate source errors prior to processing (eg to ensure there are no strings as values for Current Loan Balance)
Modelers can then easily define (via script, template or our AI qPilot) any mathematical operation to be performed across data tapes (periods).
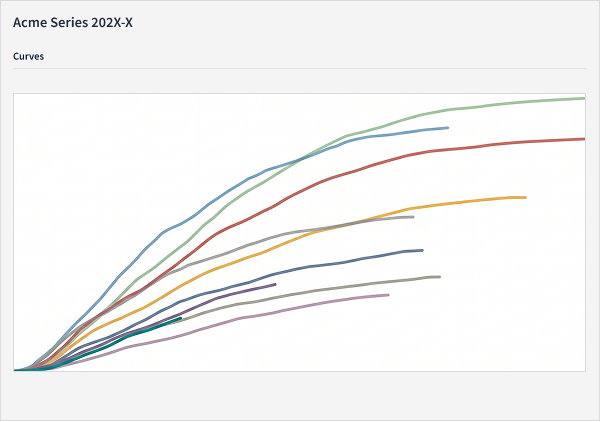
Use Curve Maker to plot: prepayments, (days of) delinquency, defaults, losses, scheduled and unscheduled principal, and any other parameter available in a client data tape, across time.

Pool performance curves are then available in the Reports tab, where they can be shared with explicit permissions, via URL or API, and bulk downloaded.
Calculations are instantly performed and cached.
Rolling forward a curve for a new cut-off date, or updating a single historical period to address an error, is as simple as uploading a new data tape or swapping out the old.
Data tables are then available in the Reports tab and can be integrated into internal systems via API.
Automated ingestion is available by request.

Quantum reports and solvers can be instantly deployed into any model, saving hours in implementation time, reducing errors, and ensuring consistency across models.
While modelers can view Reports and Model Maker, investors only access the Reports tab.
The Reports tab showcases transaction documentation (eg the OM and remits), the Model Scenarios configuration, and a list of all reports available to a model.
Report viewers can view pre-baked Deal Scenarios (often what is shown in the OM's decrement tables) or configure custom Mode Scenarios.
Report viewers can download a single report into Excel or easily bulk download multiple reports across multiple scenarios, into a single "committee-ready" Excel file.
Quantum offers over a dozen collateral reports, liability reports, and solvers which are consistently available to any modeled transaction via the GUI and API.

A NEW PARADIGM IN MODELING
Quantum's ease of use, support of asset classes, and stakeholder accessibility unlock totally new capabilities.
It's fast
+10x faster
Quantum qScript is easy to onboard, implement, and debug, and orders of magnitude faster at compute than comparable Excel and Python scripts.
Learn it within 2 weeks
for modelers to onboard
Free to share
investor access to model reporting
It's scalable
-75% the price
Quantum's licensing fees are a fraction of the cost of legacy solutions, while offering significantly more capability, broader access, and easier API integration.
Fully supported
by Quantum's expert modelers
99.9% uptime
platform reliability and performance